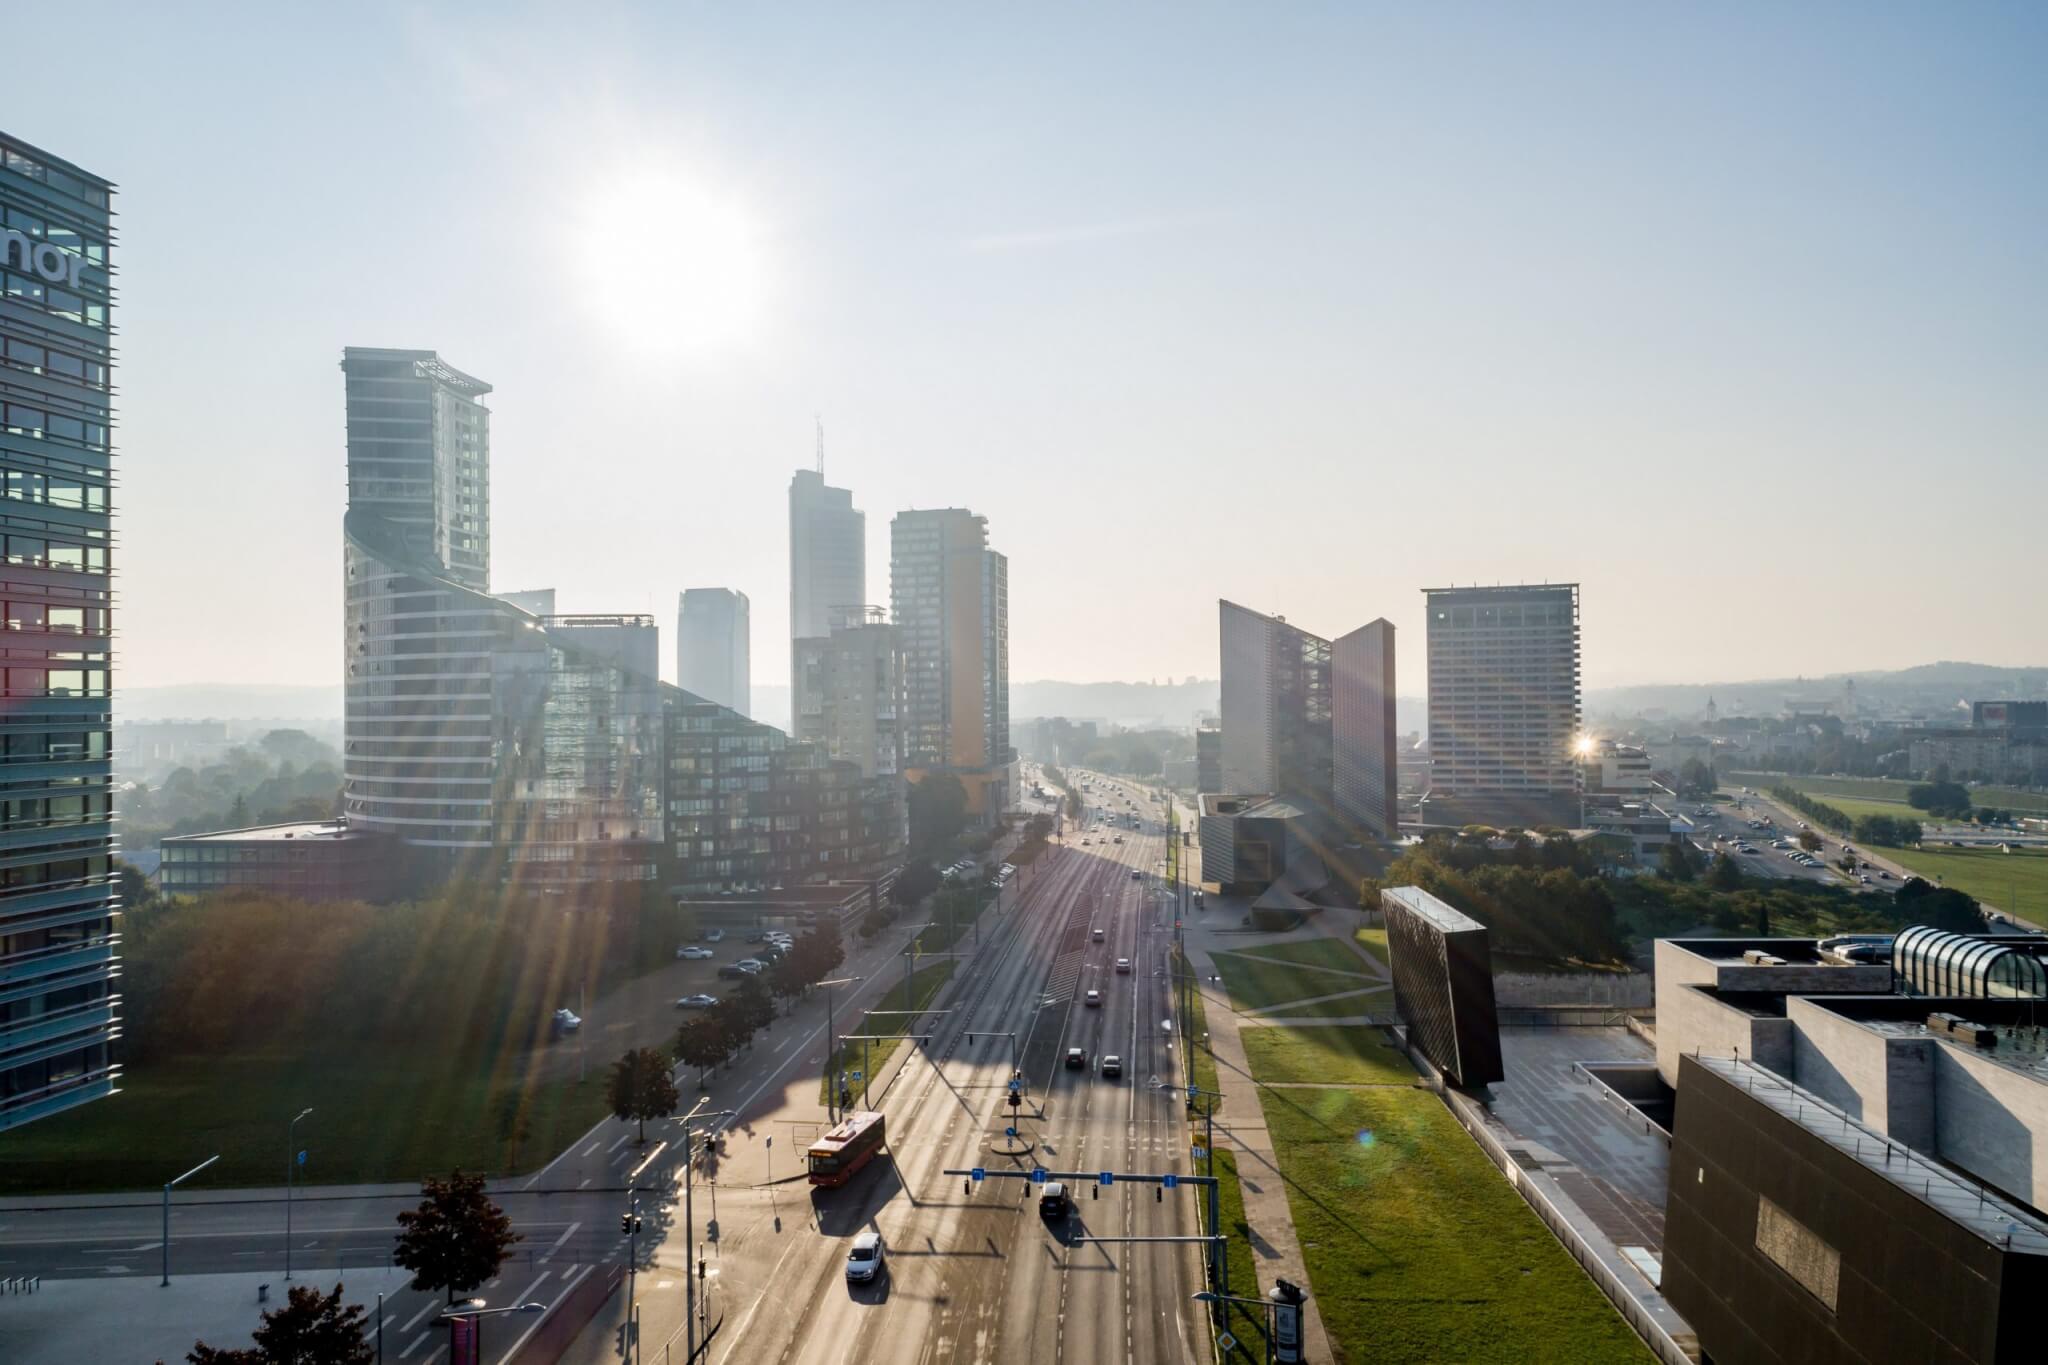
Vilnius is one of the greenest cities in Europe, constantly monitoring the city’s air quality and opening up key environmental indicators to the public. The Vilnius City Interactive Mapping System now includes an ambient air pollution theme, which highlights the capital’s key air quality indicators. The interactive map provides forecasts of Vilnius’ air quality, concentrations of air pollutants tested in previous years, and links to detailed air quality reports on pollution from households and busy streets.
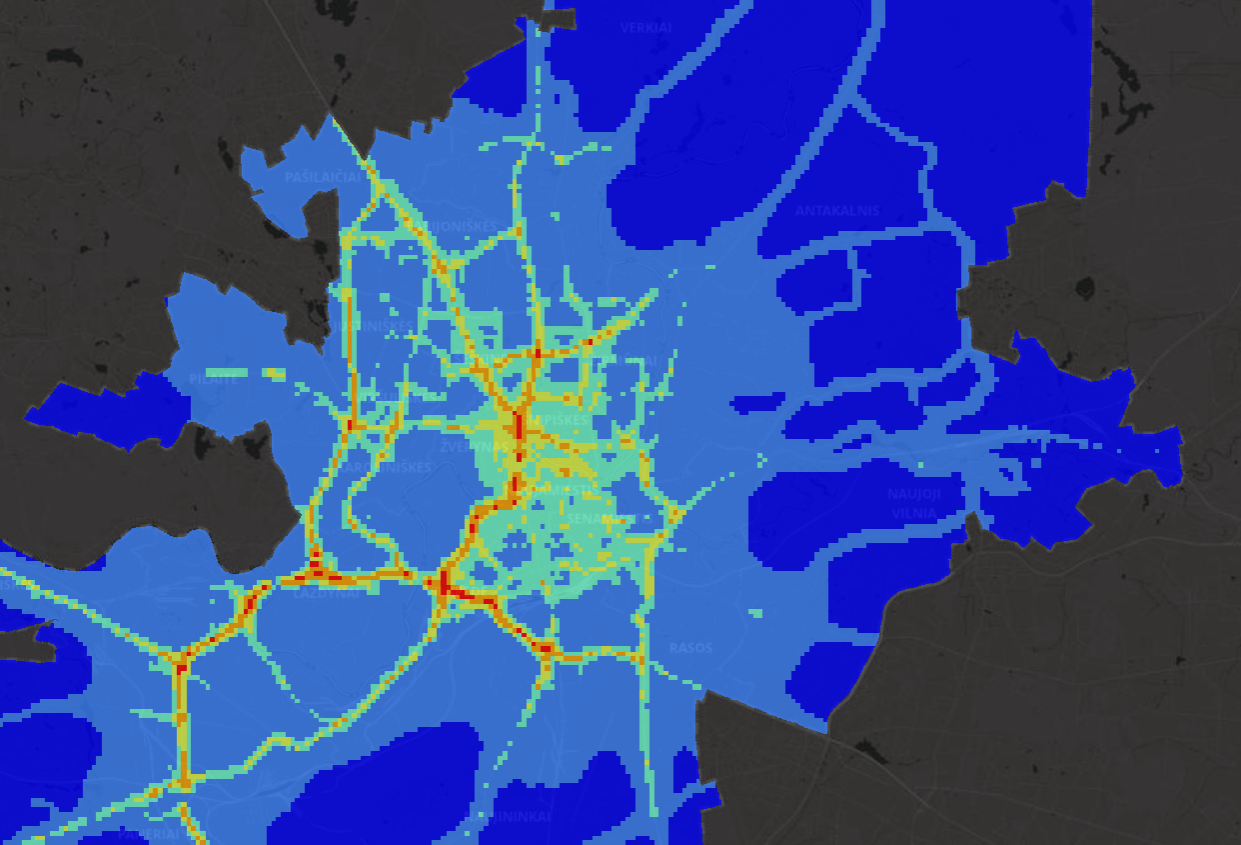
Vilnius air pollution scenario for 2025
To develop the ambient air quality system, specialists from the Vilnius Plan SE analysed current and historical air quality data. In the preparation of the Vilnius City Municipality Air Quality Management Programme, specialists, together with SIA ELLE and Vilnius Tech, prepared a forecast of ambient air pollution for 2025. “The system is important both for assessing the current situation and for the implementation of the ambient air quality management programme. We have analysed the available data and today we are presenting to the citizens of Vilnius not only the historical air pollution measurements but also a forecast of pollution dispersion for 2025. The development of the forecast scenario has helped us to select measures for the Vilnius City Air Quality Management Programme. And by taking into account key factors such as new buildings and streets, economic activities and heating patterns, and carrying out studies, we can see that Vilnius will have better air quality in the future.” – comments Agn? Eigminien?, Environmental Data Analyst at SE Vilnius Plan. In order to achieve the projected changes in ambient air quality, the highest priority is to reduce transport emissions, promote cleaner mobility modes or electric transport. Equally important is the consistent improvement of the urban environment through greening, intensive street cleaning and watering, and control of construction sites. Consistent urban planning, taking into account pollution zones, as well as the development of renewable energies and the promotion of efficient and sustainable energy consumption. These criteria are expected to ensure that the ambient air quality values in Vilnius in 2025 are not exceeded.
Historical data and current situation mapping in one system
The data displayed in the system allows you to assess the impact of different activities on air quality. In as many as 10 low-rise housing estates, surveys have been carried out to assess the air pollution caused by households heating individually. Experts note that the choice of heating method and meteorological conditions have an impact on the concentration of pollutants near households. Residents can also use the interactive environment to evaluate the 2019 street air pollution surveys. Specialists assessed air pollution before and after street cleaning by conducting surveys on 8 streets in the city during different periods of the spring and summer seasons. Although it is difficult to find identical environmental conditions in such studies and to compare the results with each other, the environmental data analysts recommend that street cleaning and dirt collection should be organised as soon as the winter season is over to minimise the increased environmental pollution. For those who want to monitor current air pollution or changes in recent years, annual indicators for different air pollutants monitored at national air quality monitoring stations are provided, as well as the results of air pollution modelling, which are shared by the Environmental Protection Agency. The system allows the analysis of carbon monoxide, sulphur dioxide and a wide range of pollutants for the period 2014-2020, with readings for 2021 to be added soon.